

Table of Contents
Financial Analysis of Verizon
Financial analysis is important to the firm’s management and investors. It provides the financial health of the company and guide on the best business strategy and investment decision respectively. By determining the probability of failure and bankruptcy, investors can initiate preventive measures to minimize loses (Wahlen, Bradshaw & Baginski, 2015).. This section of the report investigates the financial health of Verizon Inc. Also, the financial performance is compared to that of its major competitor—AT &T. The firm’s income statement, balance sheet and the statement of cash flows will be evaluated to provide an in-depth view of the financial health. The solvency, profitability and liquidity ratios are hereby determined to provide a comprehensive view of the company as highlighted below;
| Metric | Ratios |
| Solvency | Debt ratio Debt to Equity ratio |
| Profitability | Profit margin Return on Assets |
| Liquidity | Cash ratio Current ratio |
Liquidity Ratios
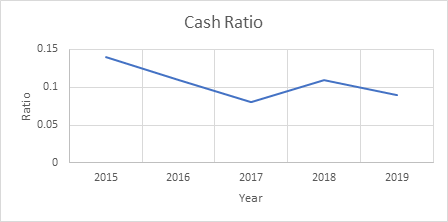
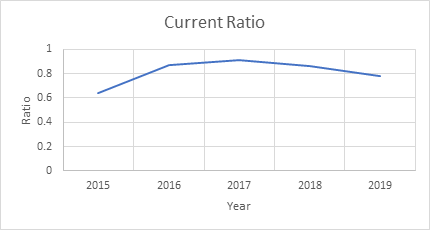
These ratios assess the firm’s ability to meet its short-term debt obligations when they fare due. Liquidity ratios show the number of times that the short-term obligations can be met by liquid assets and cash. The liquidity ratios of Verizon are highlighted using cash ratio and current ratio. The values used are end year values.
| Ratio | 2015 | 2016 | 2017 | 2018 | 2019 |
| Cash ratio | 0.14 | 0.11 | 0.08 | 0.11 | 0.09 |
| Current ratio | 0.64 | 0.87 | 0.91 | 0.86 | 0.78 |
Generally, a liquidity ratio more than one implies that short-term obligations can be met comfortably. In the case of Verizon, the firm cannot meet its short-term financial obligations fully. From the assessment, the cash ratio has been dwindling from 2015. The ratio decreased from 2015 to 2017, rose in 2018 and eventually fell in 2019. Similarly, the current ratio has been decreasing since 2017.
Profitability Ratios
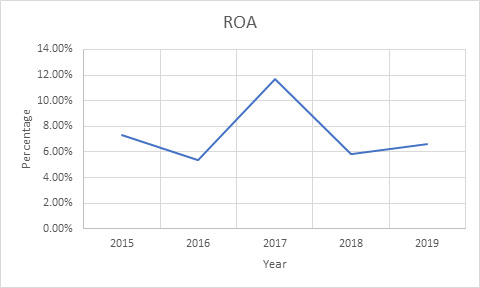
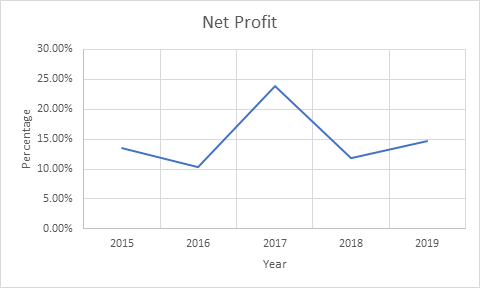
These ratios indicate the firm’s ability to generate profits relative to balance sheet assets, revenue, shareholders’ equity and operating costs in a given period. They show how well Verizon utilizes assets to generate value for the shareholders. The profitability ratios are as highlighted below;
| Ratio | 2019 | 2018 | 2017 | 2016 | 2015 |
| ROA | 6.60% | 5.86% | 11.71% | 5.38% | 7.32%S |
| Profit Margin | 14.61% | 11.87% | 23.88% | 10.42% | 13.58% |
From the ratios, the ROA of Verizon has been fluctuating since 2015. The highest return on assets of 11.71% was realized in 2017. Similarly, the net profit margin has been fluctuating since 2015. Similarly, the highest net profit margin of 23.88% was realized in 2017.
Solvency Ratios
Solvency ratios assess Verizon’s ability to meet its debt obligations. It indicates the sufficiency of the cash flow to meet the short- and long-term liabilities of the giant telco firm. Solvency ratios of Verizon are indicated below;
| Year | 2019 | 2018 | 2017 | 2016 | 2015 |
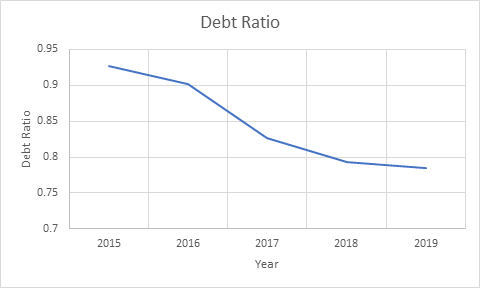
| Debt Ratio | 0.7846 | 0.7934 | 0.8262 | 0.9016 | 0.9269 |
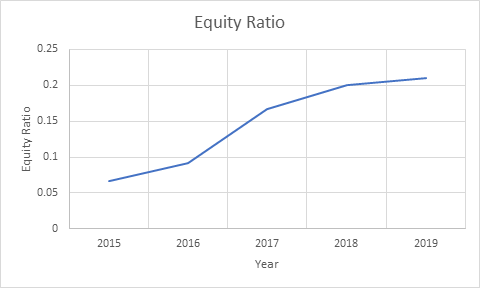
| Equity Ratio | 0.2105 | 0.2007 | 0.1676 | 0.0922 | 0.0673 |
From the ratios, the debt ratio of Verizon has been deteriorating since 2015. However, the firm is in a good position to pay its creditors based on the debt ratios. On the other hand, the equity ratio has been improving since 2015. However, the equity ratio has been less than 0.5 throughout the five years. This shows that Verizon uses majority of Verizon’s assets are funded by stock rather than shareholders’ equity. This makes it less popular as an investment option. Investors prefer conservative firms (Wahlen, Bradshaw & Baginski, 2015).
Comparison of Verizon with AT&T
According to Stock Analysis (2020), the ratios of AT&T are as follows;
Liquidity Ratios
| 2015 | 2016 | 2017 | 2018 | 2019 | |
| Quick ratio | 0.45 | 0.45 | 0.82 | 0.49 | 0.50 |
| Current Ratio | 0.75 | 0.76 | 0.97 | 0.80 | 0.79 |
AT&T Liquidity Ratios
Comparing the liquidity ratios of AT&T with Verizon’s, AT &T has relatively higher ratios compared to Verizon. This shows that it is in a better position to offset its short-term financial obligations than Verizon.
Profitability Ratios
| 2019 | 2018 | 2017 | 2016 | 2015 | |
| ROA | 2.52% | 3.64% | 6.63% | 3.21% | 3.31% |
| Net Profit Margin | 7.67% | 11.34% | 18.34% | 7.92% | 9.09% |
AT&T Profitability Ratios
The profitability ratios of Verizon are relatively higher compared to that of AT&T.
Solvency Ratios
| Year | 2019 | 2018 | 2017 | 2016 | 2015 |
| Debt Ratio | 0.3 | 0.33 | 0.37 | 0.31 | 0.31 |
| Equity Ratio | 0.89 | 0.96 | 0.17 | 1 | 1.03 |
AT&T Solvency Ratios
Comparing the solvency ratios shows that Verizon has a higher debt ratio compared to AT&T. This shows that the firm is in a better position to pay its creditors compared to the latter. On the other hand, AT&T has higher equity ratios compared to Verizon. This shows that majority of its assets are funded by shareholders equity compared to Verizon. Generally, Verizon is a better investment option due to its high profitability and the ability to meet its long-term financial obligations. As highlighted in the ratios, Verizon appears to be headed in the right direction.
Don’t use plagiarized sources. Get an original essay on the Analysis of Verizon Today from just $8/page


