Profit Margin
Profit Margin Assignment
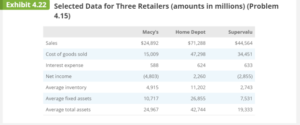
Exhibit 4.22 presents selected operating data for three retailers for a recent year. Macy’s operates several
department store chains selling consumer products such as brand-name clothing, china, cosmetics, and
bedding and has a large presence in the bridal and formalwear markets (under store names Macy’s and
Bloomingdale’s). Home Depot sells a wide range of building materials and home improvement products,
which includes lumber and tools, riding lawn mowers, lighting fixtures, and kitchen cabinets and appliances.
Supervalu operates grocery stores under numerous brands (including Albertsons, Cub Foods, JewelOsco, Shaw’s, and Star Market).
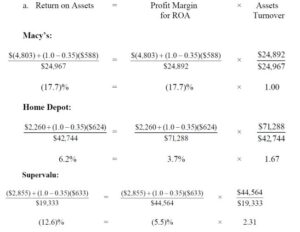
- Compute the rate of ROA for each firm. Disaggregate the rate of ROA into profit margin for ROA
and assets turnover components. Assume that the income tax rate is 35% for all companies. - Based on your knowledge of the three retail stores and their respective industry concentrations, describe
the likely reasons for the differences in the profit margins for ROA and assets turnovers.
Answers


Macy’s performed poorly, reporting a large net loss. It also has the slowest assets turnover of the
three companies. Its product line is less commodity-like than either Supervalu’s or Home Depot’s. Its
clothing has a higher fashion orientation, allowing it normally to achieve a high profit margin (lower
cost of goods sold to sales percentage).
One would expect Macy’s to have the highest profit margin.
The greater use of sales personnel in stores increases its selling expenses. Each store tends to be
unique in terms of design and construction, which increases building costs and lowers the fixed asset
turnover.
However, margin is masked by the overall net loss for the year. As Macy’s reports in its
10-K, “In recent periods, consumer spending levels have been adversely affected by a number of factors,
including substantial declines in the level of general economic activity and real estate and investment
values, substantial increases in consumer pessimism, unemployment and the costs of basic necessities,
and a significant tightening of consumer credit.
These conditions have reduced the amount of funds
that consumers are willing and able to spend for discretionary purchases, including purchases of some
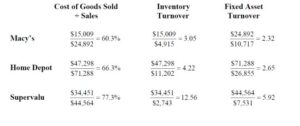
of the merchandise offered by the Company.” Its inventory turnover is, not surprisingly, the lowest of
the three companies because it uses low prices as a strategy less frequently. As a result, its total asset
turnover is the lowest of the three companies.
Home Depot was the only profitable company, so it is the only company showing a positive profit
margin for ROA. Combined with total assets turnover between the other two companies, Home Depot
reported a respectable 6.2% ROA when many other companies reported losses. Perhaps this reflects
a combination of efficient operations combined with continued demand for do-ityourself products,
which persist during economic downturns, as homeowners perform work that they would otherwise pay
professionals to do.
Nevertheless, Home Depot’s performance deteriorated from prior years, and the 10-
K states, “. . . the housing, residential construction and home improvement markets have deteriorated
dramatically and more severely than was previously anticipated.” Home Depot has the second highest
COGS/Sales percentage, which falls between the branded items sold by Macy’s and commodity items
sold by Supervalu.
Home Depot’s overall asset turnover also lies between Macy’s and Supervalu, but
individual asset turnover ratios lie closer to Macy’s than to Supervalu, which is not surprising given
Home Depot’s inventory of nonperishable products.
Overall, Home Depot’s profitability likely resulted from lower selling and administrative expenses as a percentage of sales. Home Depot probably offer less sales help in its stores than Macy’s does. Home Depot also holds down administrative expenses by building similar stores and spreading such costs over a larger number of stores. Its mid-range assets turnover reflects mid-range inventory and fixed asset turnovers. Its building costs are likely similar to
those of Supervalu, but Home Depot does not turn over its inventory as rapidly. The slower inventory
turnover decreases sales and therefore decreases the fixed asset turnover.
Supervalu sells grocery products, which are essentially commodities. There also is extensive competition
in the grocery products business. Thus, one would expect it to have the lowest profit margin for ROA,
but this was a year in which many companies reported losses, and the grocery industry was no different.
The 10-K reports, “The unprecedented decline in the economy and credit market turmoil during fiscal
2009 combined with high food inflation and energy costs negatively impacted consumer confidence and
spending.” [Supervalu’s fiscal year ended February 28, 2009, which management refers to as their 2009
year, but we adopt the common treatment of describing this fiscal year as 2008 because 10/12ths of
their fiscal year is in calendar 2008.]
Note that it has the highest cost of goods sold to sales percentage of the three companies, indicating the commodity nature of its products and the relatively small markup of selling prices over costs. Supervalu also has the highest assets turnover, the result of a rapid inventory turnover and relatively low investment in fixed assets, especially compared to Macy’s.
Supervalu’s rapid inventory turnover also results from the perishable nature of many of its products.
The rapid inventory turnover increases sales and thereby the fixed asset turnover as well. Its stores
are less complicated to build and thus are less costly than those of department stores.


